
Postgres Remembers, Claude Diagnoses: My LangGraph Self-Heal Loop
Hi All,
My LangGraph agent passed manual QA and cleared dev deployment. Then real users hit it in a higher environment. There was no single bug — instead, thousands of odd traces: the orchestrator routing to the wrong corpus in one case, the retriever missing entirely in another. Azure Monitor was capturing all of it. Nobody was learning from it.
Traces without a loop are just expensive receipts.
Hamel and Shreya put it bluntly: “Error analysis is the most important activity in evals. It helps you decide what evals to write in the first place.” (AI Evals FAQ) Our nightly Claude job is exactly that — systematic error analysis at scale, not a metrics dashboard.
Postgres is memory. Azure is eyes. Claude is brain.
Why two stores (the separation that matters)
A single telemetry store is tempting. But traces and logs answer different questions.
Postgres (durable store) — system of record for business questions:
- Did the interaction finish as completed or failed?
- Which route did the graph take?
- Which tools executed, with what arguments, results, retries?
- Which data was accessed (Postgres, vector, search)?
- What citations supported the answer?
- What was the bounded error code and failure stage?
Azure Monitor (operational store) — live view for runtime questions:
- Where did latency accumulate across nodes and dependencies?
- Which graph node threw an exception?
- Are HTTP or database dependencies slowing down?
- Did failures increase after a deployment?
- Are requests reaching the service and streaming successfully?
They overlap deliberately. Correlation happens via request_id + interaction_id — not by duplicating everything into both systems.
Adversarial sampling, done right. Most evals sample where today’s model fails — measuring that model’s fingerprint, not task difficulty. Our nightly job does the opposite: it samples where production actually failed. Real users, real data, real routing mistakes, real retriever misses. The failure distribution in Postgres is the adversarial set — curated by reality, not by a model’s weaknesses. The principle is simple: pick hard cases because a human (production) judged them hard, not because a model stumbled. Our eval set is stolen from prod for a reason: it’s the only distribution that matters.
The schema that survives contact
Two tables worked at 100 runs/day. At 5k/day, the questions we asked outgrew the schema. The pattern that scales:
| Table Role | What It Captures | Why It Matters |
|---|---|---|
| Interaction root | One row per user-agent turn: correlation IDs, user/role context, timestamps, status (started/completed/failed), graph route, grounding layers, token count, response metadata, bounded error code + failure stage |
Controlled lifecycle. Fail-closed: if audit record can’t start, request doesn’t proceed. |
| Tool executions | Each tool call: graph node, retry attempt, success/failure, duration, row count, SQL/query evidence | Enables tool-count parity, retry-rate analysis, SQL failure clustering |
| Data access | Which store was hit, resource type, identifiers | RAG citation coverage, grounding provenance |
| Citations | Answer → retrieved chunk mapping | Citation coverage % by route |
| Messages | Persisted user/assistant messages linked to interaction | Conversation reconstruction |
| Learnings | Verified error fixes (e.g., SQL repairs), linked to source interaction | Narrow runtime learning with traceability |
| Knowledge versions | Provenance for versioned grounding assets (taxonomy, guardrails, examples) | Know what grounding was active per interaction |
The interaction root begins as started and is conditionally finalized once — atomic commit of terminal state, messages, response metadata, and citations in one transaction. Timeouts, client disconnects, routing failures, response generation failures all attempt a bounded transition to failed. This prevents infrastructure errors from being mislabeled as valid out-of-scope answers.
Privacy-safe aggregation — the query the nightly job actually runs (no prompts, answers, SQL text, IPs, tokens):
SELECT
    i.interaction_id,
    i.started_at,
    i.status,
    i.graph_route,
    i.duration_ms,
    i.error_code,
    i.failure_stage,
    i.response_components -> 'routing' AS routing,
    COUNT(t.execution_id) AS persisted_tool_count
FROM schema.ai_chat_interactions AS i
LEFT JOIN schema.ai_chat_tool_executions AS t
    ON t.interaction_id = i.interaction_id
WHERE i.started_at >= :window_start
GROUP BY i.interaction_id;
The governed loop (four stages, no magic)
1. Measure with code
Deterministic aggregates the model should never calculate:
- Terminal-state coverage
- Blank-completion rate
- Tool-count parity
- Tool retry rate
- RAG citation coverage
- Latency percentiles by route
- Failures grouped by bounded error code + stage
- Routing distributions by taxonomy version, domain, capability, confidence band, decision source, reason code
Hamel and Shreya report spending 60–80% of development time on error analysis and evaluation across projects (AI Evals FAQ). Our deterministic aggregates exist to reduce that manual burden, not replace the sensemaking.
2. Judge with model
Once deterministic aggregates and a small sanitized sample exist, the model handles what requires judgment:
- Classify recurring failure patterns
- Summarize likely root causes
- Distinguish prompt ambiguity from missing knowledge
- Identify taxonomy gaps and overlaps
- Draft candidate regression cases
- Recommend the smallest artifact that should change
Output: a proposal with evidence, not an automatic production edit.
Validation rigor: “Ground truth labeling — for any data used for testing/validating LLM-as-Judge evaluators, hand-validate each label. LLMs can make mistakes that lead to unreliable benchmarks.” (AI Evals FAQ) Our
learningstable enforces this — fixes are stored only after corrected execution succeeds (line 149).
3. Change the right layer
Different findings belong in different artifacts:
| Finding | Change |
|---|---|
| Instructions unclear, structure drifts, policy ignored | Prompt |
| Analysis workflow misses evidence, wrong diagnostic sequence | Skill |
| Intent families misrouted, unnecessary model calls, needs bounded clarification | Routing taxonomy |
| Metric definitions, grain, freshness, domain terms missing/contradictory | Business knowledge |
| Repeatable SQL/schema failures, safety violations | Query examples / guardrails |
| Deterministic, transactional, perf, ops failures | Code / infrastructure |
Prompts don’t compensate for code defects. The versioned declarative routing taxonomy makes this concrete: every routing decision carries bounded fields (route, decision_source, taxonomy_version, domain, capability, confidence, reason_code, duration). Domain logic lives in a reviewable artifact, not hidden in free-form prompt text.
4. Validate before deploy
Every recommendation becomes a normal reviewed change:
- Add a sanitized regression case that reproduces the failure
- Make the smallest prompt/skill/taxonomy/knowledge/code/infra change
- Run deterministic routing and graph tests
- Compare quality metrics against previous baseline
- Deploy through controlled pipeline
- Observe the next window in Postgres and Azure Monitor
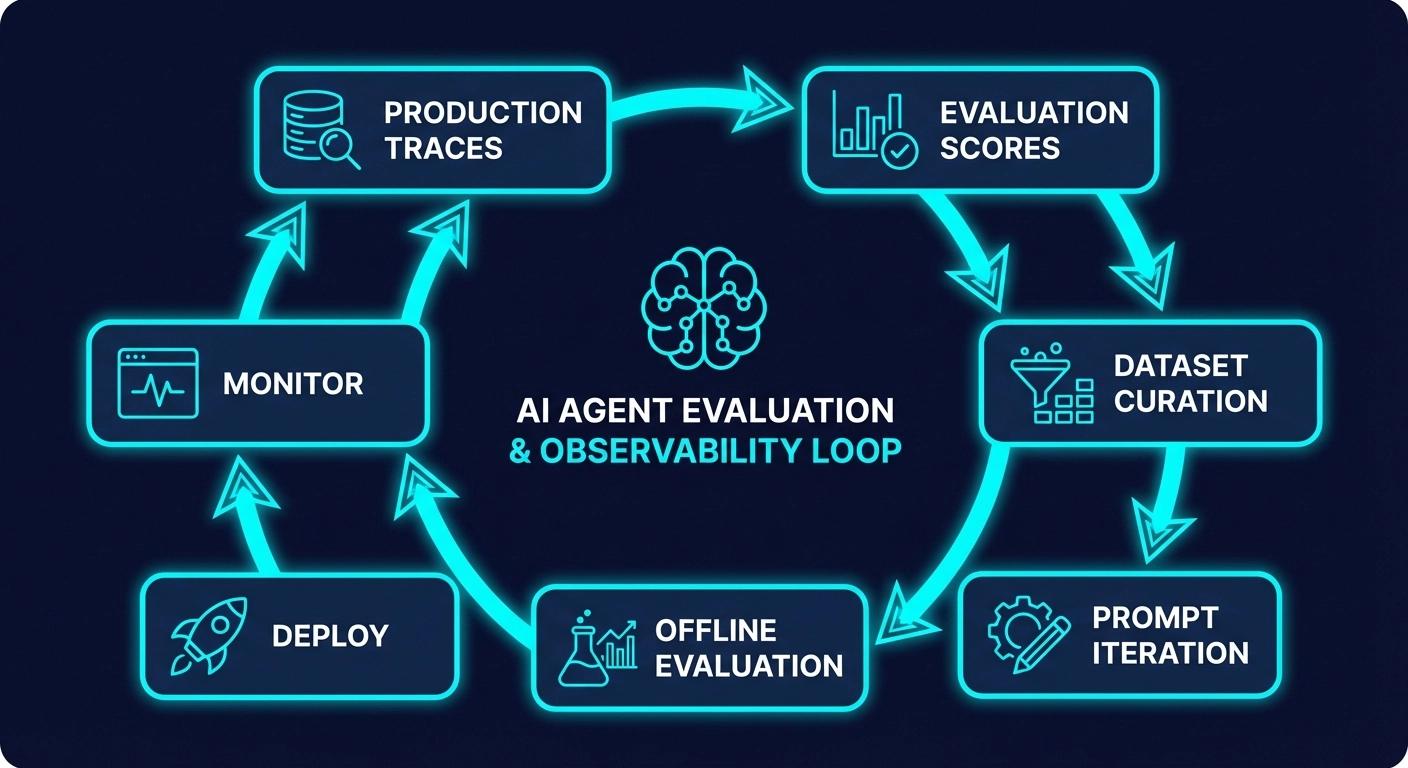
The loop: observe → measure → diagnose → propose → review → test → deploy → observe again.
The discipline that makes this loop trustworthy is stolen from how strong evals are built: every proposal is validated against a held-out test set the analyzer never sees. If the nightly job’s diagnosis improves the training failures but the test failures stay flat, the proposal is discarded — it overfit to yesterday’s errors. If both improve, the change ships. This single rule — train and test must move together — is what separates a governed loop from a hallucinated one. It’s the same principle Claude’s hillclimber enforces: split the cases, never paste failures into the prompt, keep answers structurally out of reach.
The narrow learning loop that exists today
SQL error learning (generalizes to any repeatable tool failure pattern):
On tool failure:
  1. Search learnings table for matching active fix
  2. If none, ask model to diagnose the error
  3. Store fix ONLY after corrected execution succeeds
  4. Retain source interaction ID for traceability
That’s it. No prompt rewriting. No taxonomy mutation. No autonomous skill updates.
This boundary matters: production behavior improves through evidence and review, not silent self-modification.
Bucket → fix: closing the loop (the part most posts skip)
- tool-arg fails → added JSON-schema verifier eval, reject before execute
- planner loops → added step-count guard + “try different approach” nudge
- retriever misses → turned 50 prod misses into golden eval set, test every embedding change against it
One number that moved: Tool-arg failure rate dropped 73% → 12% after adding the JSON-schema verifier eval. One number beats ten adjectives.
What I learned
- Batch beats realtime for learning. Nightly Claude job > streaming classifier.
- Binary buckets beat scores. Yes/no “was this a tool-arg fail?” calibrates; 1-10 doesn’t.
- Humans moved up-stack. We stopped writing envs, now we just review Claude’s buckets and bless fixes.
Hamel advocates one domain expert (“benevolent dictator”) reviewing traces, and building a custom annotation tool — “teams with custom tools iterate ~10x faster” (AI Evals FAQ). Our nightly job + Postgres is that custom tool. The governance layer (review → test → deploy) is the dictator’s veto.
- Your eval set should be stolen from prod. Ours is.
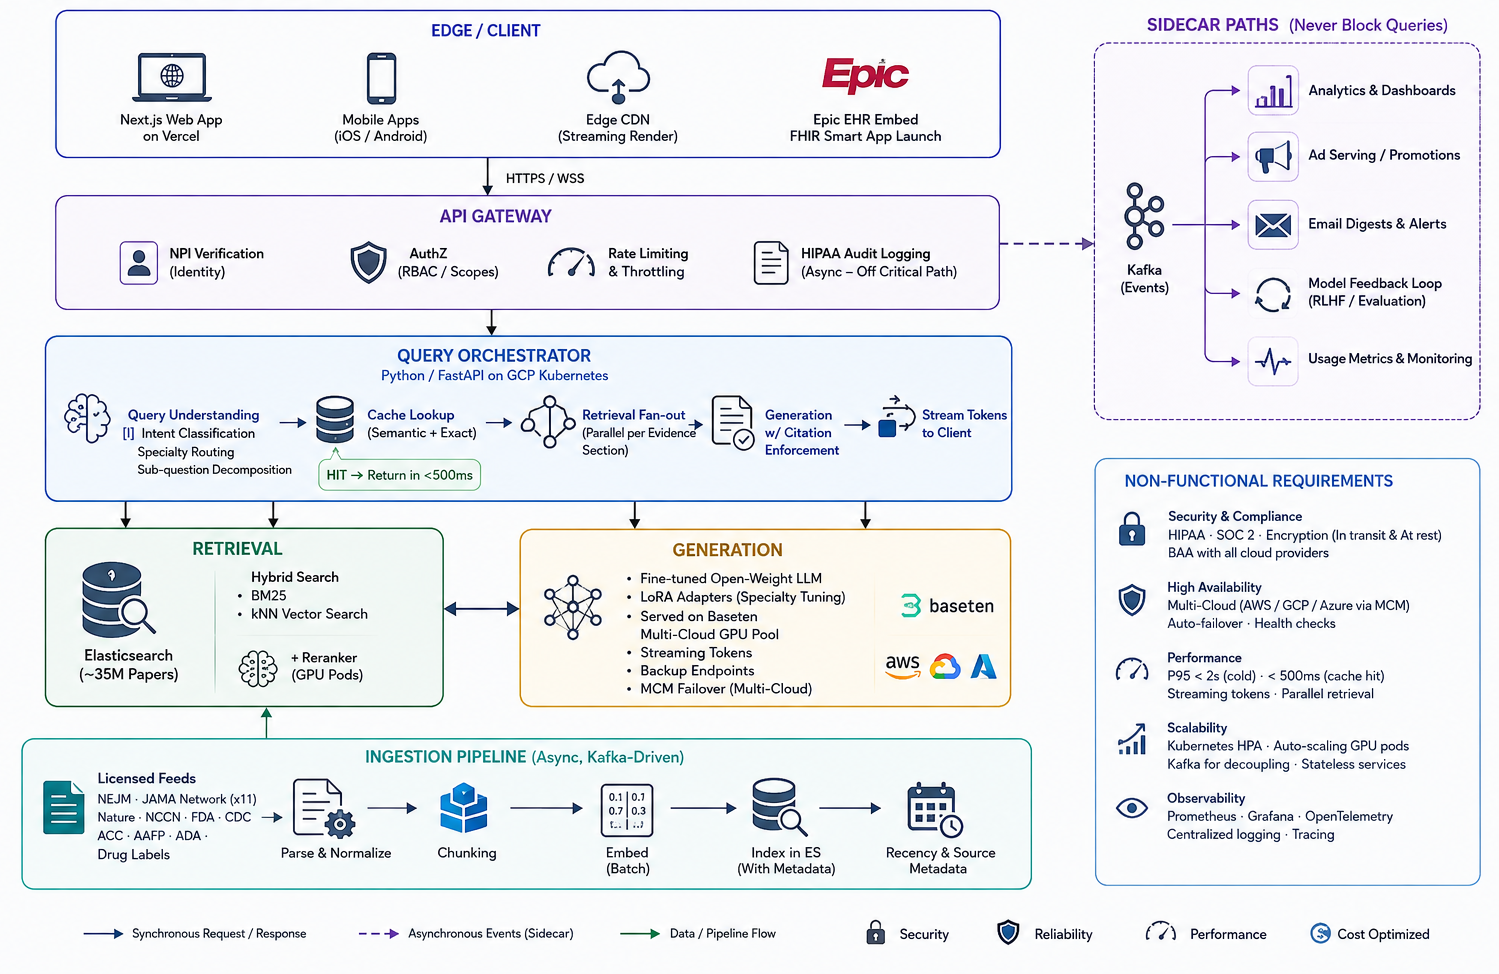
- The schema evolves toward the questions you ask, not the events you emit. At 5k runs/day we split the hot ingestion path from the analytical path — a stream consumer classifies inline, materialized views serve dashboards and the nightly job, raw checkpoints archive to S3.
- Governed loops > autonomous loops. The analysis skill is deliberately read-only. Its job is to gather evidence and propose changes, not to mutate production records or rewrite the agent automatically.
The larger lesson
Agent observability isn’t distributed tracing with an LLM in the middle. A useful system needs three things:
- Durable evidence of what the agent decided and what data/tools supported the answer
- Operational telemetry explaining timing, dependencies, failures while running
- A governed improvement process converting repeated evidence → tested, versioned changes
Postgres + Azure Monitor give you 1 & 2. The analysis skill closes the loop by making improvement repeatable without making it uncontrolled.
That’s how traces become more than debugging artifacts: they become the evidence base for building a safer, more reliable, more understandable agent.
Footnote: Criteria drift. Research shows evaluation criteria shift after reviewing model outputs. This is why our loop has human review between diagnosis and deploy — the criteria aren’t static.
Thanks, Ashish
Leave a comment