Market Mix Modeling using Pycaret and Streamlit (part 2)!!
Hi there,
This post is an extension of my previous post Market Mix Modeling using Pycaret and Streamlit (part 1). We will see how can we build a sharable web app in minutes using Streamlit. Streamlit is a Python-based, open-source platform to build and share data apps. The best thing is that the syntax is very intuitive.
# Loading the required packages and modules
from pycaret.regression import load_model, predict_model
import streamlit as st
import pandas as pd
import numpy as np
import os
from PIL import Image

# Load the saved model
model = load_model('saved_MMM_lr')

# Prediction function
def predict(model, input_df):
    predictions_df = predict_model(estimator=model, data=input_df)
    predictions = predictions_df['Label'][0]
    return predictions

# Read the .py file for 'show code' button
file = "C:\\Users\\ashis\\PycharmProjects\\MMM\\main.py"
def get_data_as_string(file):
    return open(file,"r").read()

# Data load
path = "D:\Python Files"
file_name = "Advertising.xlsx"
input_file = os.path.join(path,file_name)
def load_data():
    data = pd.read_excel(input_file, engine='openpyxl')
    return data
-
load_model(): We load the saved model (.pkl) file from the last post. We use this model for point (online) or batch prediction.
-
predict(): We use this function for point prediction. We leverage predict_model() function for prediction and picking the ‘Label’ value as a prediction.
-
get_data_as_string(): We have a show code button on the web app which shows the python code once clicked. This function helps to pull the .py file as a string and decode it to ‘utf-8’
-
load_data(): This function loads the input data. I leverage this data to get the upper and lower limits for the sliders.
data = load_data()

min_TV = np.float(data['TV'].min())
max_TV = np.float(data['TV'].max())

min_Radio = np.float(data['Radio'].min())
max_Radio = np.float(data['Radio'].max())

min_News = np.float(data['Newspaper'].min())
max_News = np.float(data['Newspaper'].max())
In the above snippet, we are finding the minimum and maximum values of each marketing feature so that we can leverage it for the slider range.
def run():

    image = Image.open("D:\Python Files\Image_MMM.PNG")

    st.sidebar.markdown("# Selection")
    add_selectbox = st.sidebar.selectbox("How would you like to predict?", ("Online","Batch"))

    st.sidebar.info('This is to predict sales based on marketing components.')
    st.sidebar.image(image, use_column_width=True)
    st.sidebar.success('https://ashishtele.github.io/')

    st.title("Market Mix Modeling")

    if add_selectbox == 'Online':

        TV = st.slider("Value for TV:",
                       min_value=min_TV,
                       max_value=max_TV)

        Radio = st.slider("Value for Radio:",
                       min_value=min_Radio,
                       max_value=max_Radio)

        News = st.slider("Value for News:",
                          min_value=min_News,
                          max_value=max_News)

        output = ""

        input_dict = {'TV': TV, 'Radio': Radio, 'Newspaper': News}
        input_df = pd.DataFrame([input_dict])

        if st.button('Predict'):
            output = predict(model=model, input_df=input_df)
            output = '$' + str(output)

        st.success('The sales is {}'.format(output))

    if add_selectbox == 'Batch':

        file_upload = st.file_uploader("Upload csv file for predictions", type = ["csv"])

        if file_upload is not None:
            data = pd.read_csv(file_upload)
            predictions = predict_model(estimator=model, data=data)
            st.write(predictions)

    if st.sidebar.button("Show Code"):
        st.code(get_data_as_string(file))
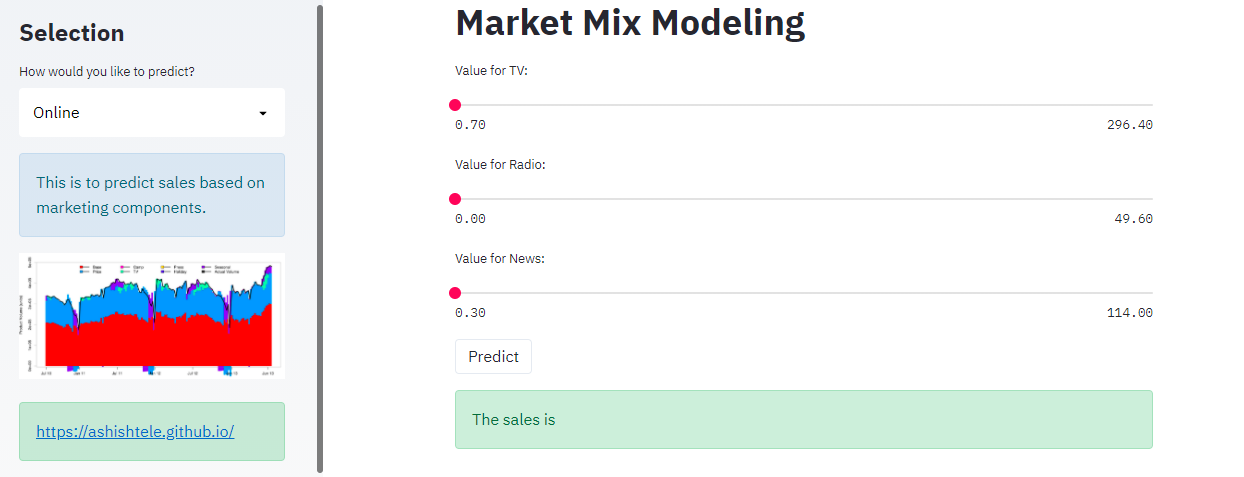
The above code snippet is self-explanatory. We are adding the different components to build the web app. We build a sidebar, add images and URLs. We provide a selection for ‘online’ or ‘Batch’ prediction. Based on the prediction type selection (Online, Batch), we execute either of two code blocks.
Online type: We collect the user input values in variables through sliders and create a pandas dataframe input_df. We pass it to predict() function and receive the point prediction. When we click on Predict button in the web app, the success message displays the result:
The sales is $X.XX
Batch type: This option asks for uploading the .csv file. predict_model() funtion predicts the batch output and displays on the web app.
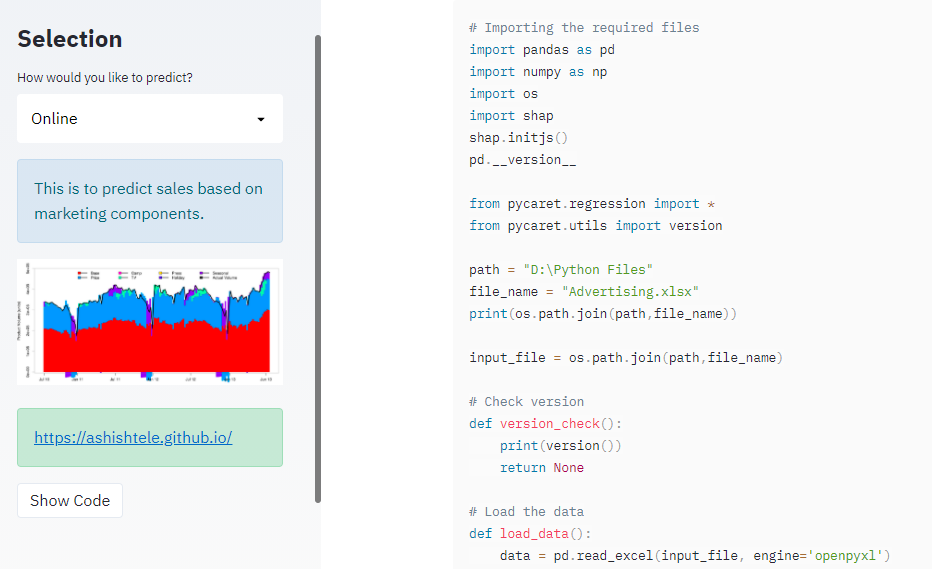
‘Show code’ button: Once clicked, it displays the PyCaret model code at the bottom. st.code() function displays the text data in the particular code language provided the language “python” name.
Next Steps:
-
Deploy the app on the server and make it available to a broader audience.
-
Improve the MMM model by feature engineering. We don’t have real-world features available in this dataset such as seasonality, Ad-Stock, price, promotions, etc.
-
Explore SHAP in more detail and find its implementation in my real-world work. MMM is a mandatory project in a consumer product company.
Stay tuned for the next steps!!
Happy New Year to All…🎉🎊🥳


Leave a comment