Automated Marketing Mix Modeling using Robyn!
Hi All,
I am returning with a new post on Marketing Mix Modeling. I came across a new release on MMM from Facebook. According to FB team, Robyn reduces human bias using ridge regression and evolutionary algorithms, aligns with the ground truth, enables actionable decision making providing a budget allocator and diminishing returns curves, and ensures privacy.
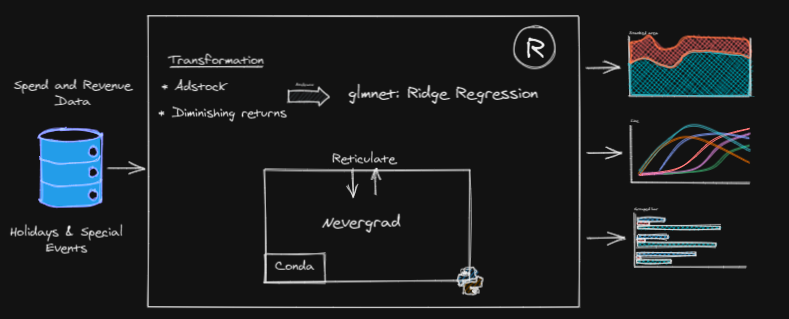
I tried to create a process flow for an illustration purpose. You can refer Robyn documentation which in itself is a great source. The entire process can be divided into 3 major parts:
1. Scripting files (.R) and data input files (.CSV):
The Facebook team has provided scripting files that contain feature engineering, modeling functions, budget allocation distribution, and plotting. The code is written in the R language. The other set of files are the raw data files. As shown in the diagram, the revenue and spend master file can be created using multiple in-house and third-party shared files. I have used data coming from multiple sources to generate the master file with different marketing channels, investments, impressions to determine the size and impact of marketing campaigns. The other file is for holidays and special events. We can add the special events as per our requirements and business needs. The holidays’ file provided by Facebook is already exhaustive enough.
The next important thing is to set variables:
- Set Country
- Set Date variable
- Set dependent variable and type
- Set Prophet and Baseline variables
- Set Media variable and Spend variable
2. Global Model Parameters:
We can set the number of cores for parallel computing. The next step is to set the data training and validation sizes. The best thing I discovered is the Bhattacharyya coefficient. It is of the amount of overlap between the two statistical samples. The higher the Bhattacharyya coefficient, the more similar the train and test data splits. We can choose an adstocking method between Geometric and Weibull. Robyn uses Nevergrad optimization library to find optimum values for coefficients.
3. Result Plots and Budget Allocator:
Once we run the iterations, the model creates the different charts that will help assess the best models and scores for the contribution of marketing channels. The budget allocator (Optimizer) provides the optimal media mix, which maximizes the return out of a certain spend level. MMM uses a ridge regression method to address multicollinearity among many regressors and prevent overfitting.
4. Variable Transformations:
Adstock: Not all effects of advertising are felt immediately-memory builds and people sometimes delay action and this awareness diminishes as time passes.
The code provides two adstock techniques:
- Geometric
- Weibull
Diminishing returns (Hill): Each additional unit of advertising increases the response but at a declining rate. There are a variety of functions to model nonlinear response to a media variable such as a simple logarithm, a power, and an S-curve transformation.
I found this approach very helpful for my project. I still have to discover many things in the Robyn, but it is a promising start.
Thanks for reading!!

Leave a comment