The way a Data Scientist analyzes an Earthquake!!
Hi All,
I am writing this blog post to share my experience of an earthquake! We were traveling from San Diego to Las Vegas through the Death Valley. We started our journey early morning to reach Vegas on time. We were enjoying the scenic view and capturing the moments. It was a hot day (105F). We decided to stop to click few pictures and fortunately, the time was perfect (scary thought!) to experience my first earthquake.
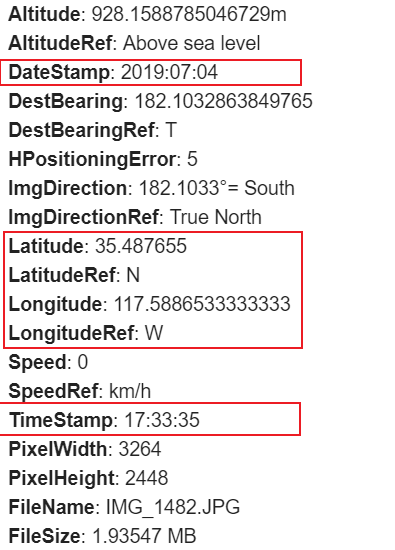
I was capturing moments through my iPhone. You can determine the location where you clicked the picture. To extract the metadata, I used the ExifWizard mobile application. It gives most of the information we require.
The below image gives the timestamp and coordinates of the location. We get many more features just through one single image captured.
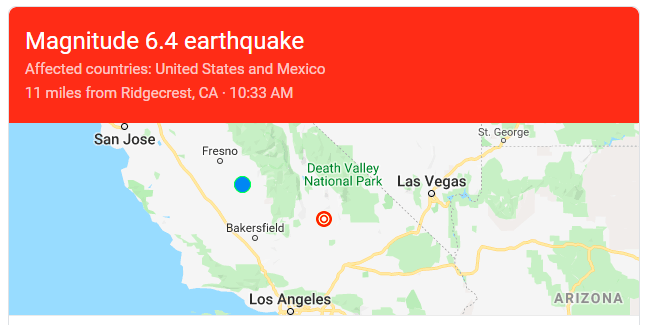
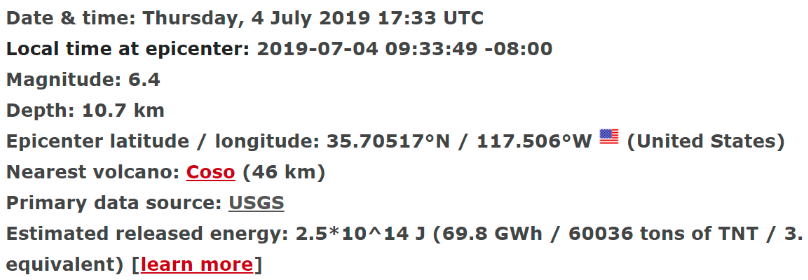
There are many sources available which provide the accurate information about the natural calamities. Volcanodiscovery is one of them. Let’s see the timing of the earthquake and its epicenter:
Source: Volcanodiscovery
We can calculate the distance based on the latitude and longitude coordinates. I used Google map distance finder to calculate the distance between the points.
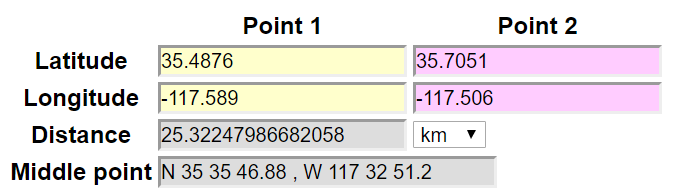
Here starts the scary part. we were this much away from the epicenter!
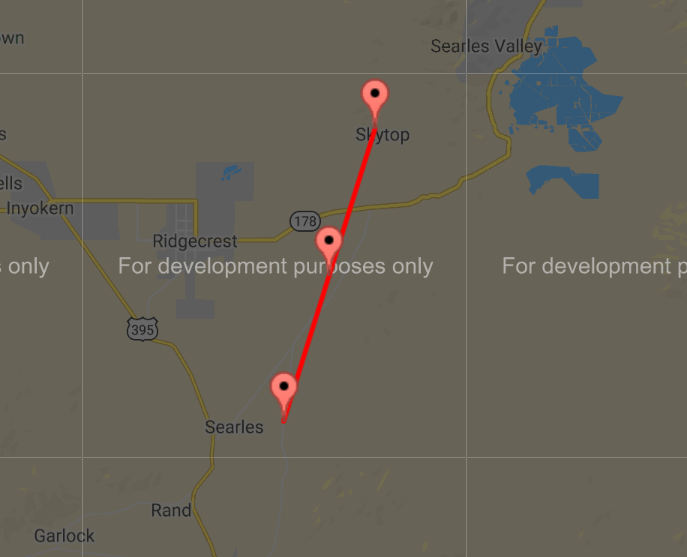
So, 25KM, that’s it!!
Volcanodiscovery provides the Distance vs Intensity graph to check the intensity (mmi) we felt.
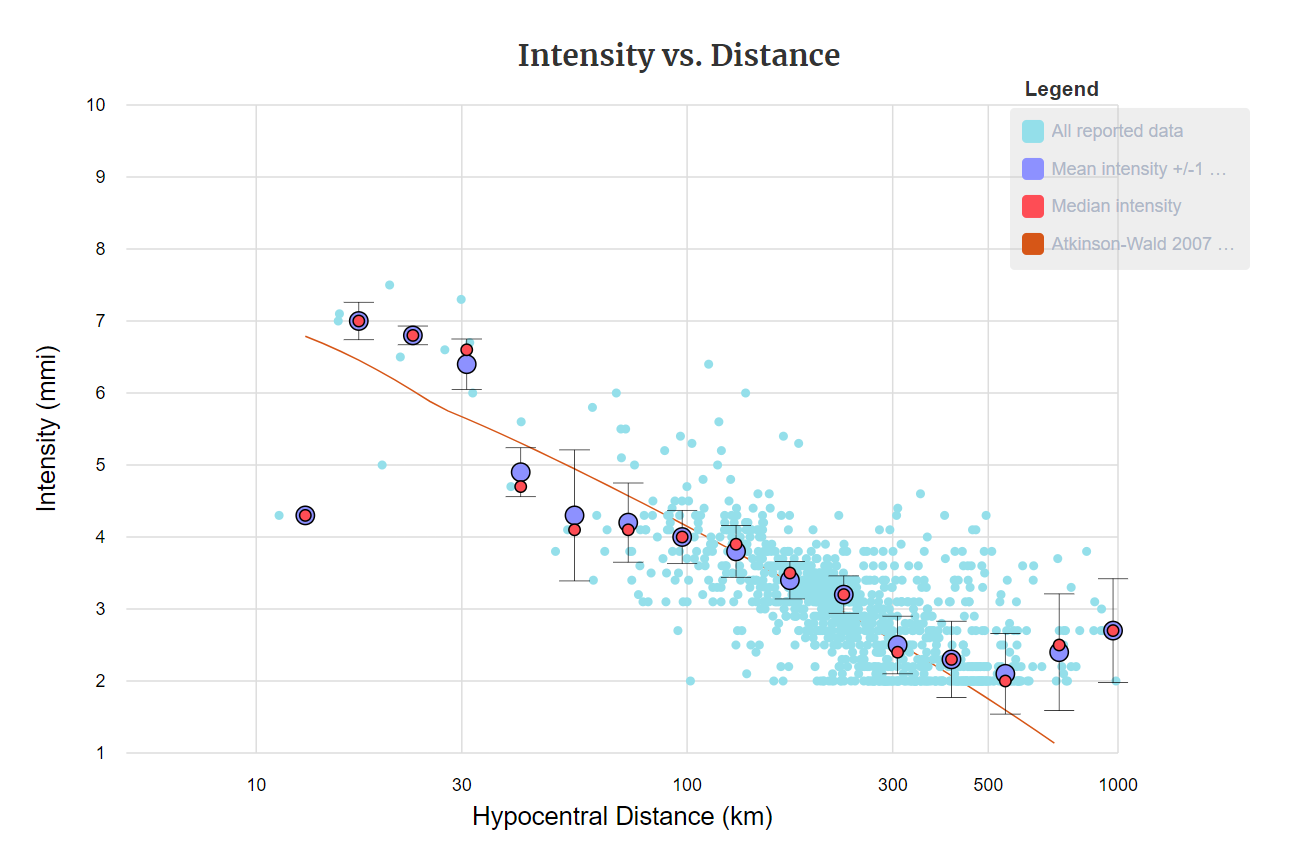
As per the graph, we felt maximum intensity of 6.8 mmi (median) at our location which was 25KM away. So next time, please plan your trip accordingly.
Crazy experience!!!
We had another surprise on July 5th(2019) as well! 🙂


Leave a comment