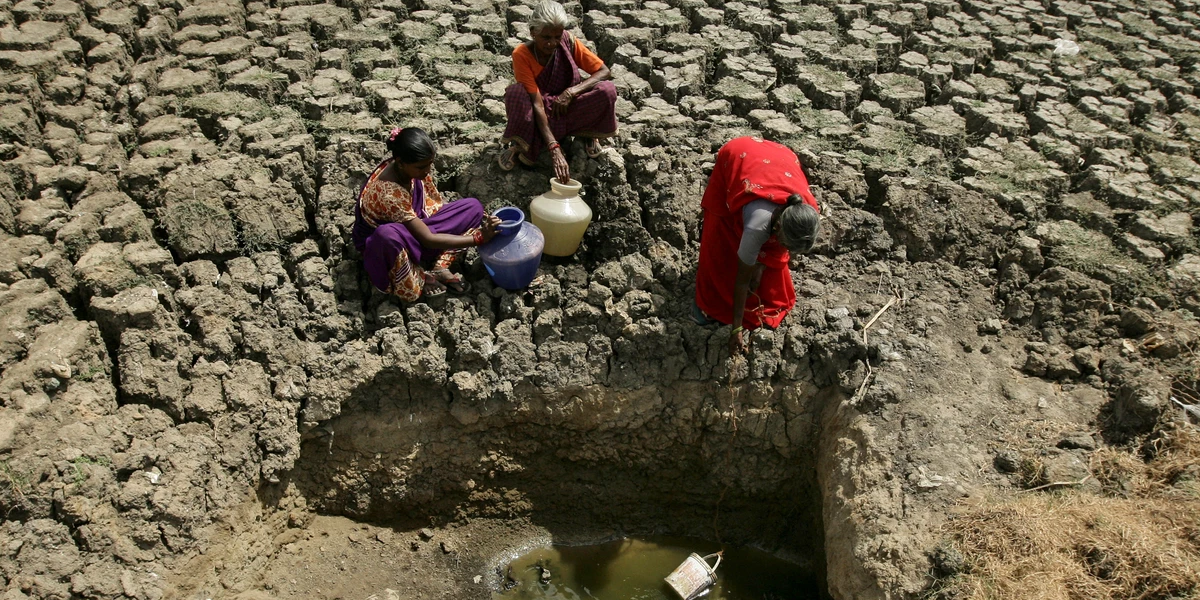
The Ground Water Crisis in India!!
I have been a big fan of open government data sources such as data.gov.in and data.gov. Recently I came across a data source called Dynamic Ground Water Resources. It has rich information about groundwater recharge (rainfall) and discharge (draft), The data column definitions were new to me so I have added them for reference purposes.
Groundwater draft: It is the quantity of groundwater withdrawn artificially or naturally from the aquifers in a study area, during a certain period. The outflow from the system is mainly considered through the groundwater draft. Ref
HaM (hectare-meter): A volume of 10000 cubic meters created by flooding an area of one hectare to a depth of one meter, thus creating a volume one hectare by one meter. Ref
It contains the information of 662 Indian districts. The overall data quality is good. It does not have many NA values. The column names (metric) are self-defining. The information is available as of March 2013.
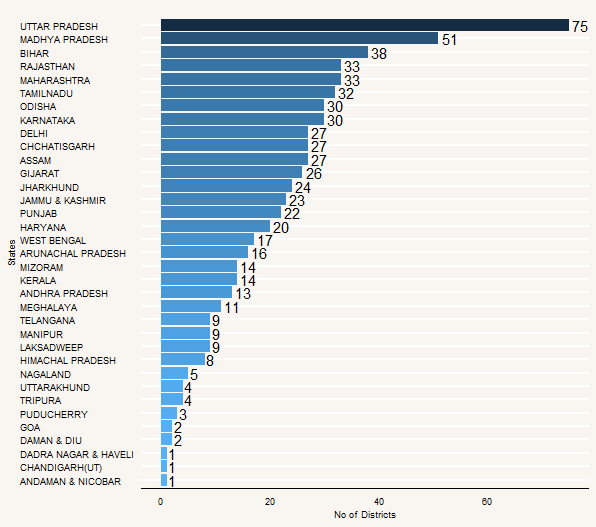
The below chart shows the number of districts by states and UTs studied to collect the groundwater data. Uttar Pradesh has most districts studied for this research.
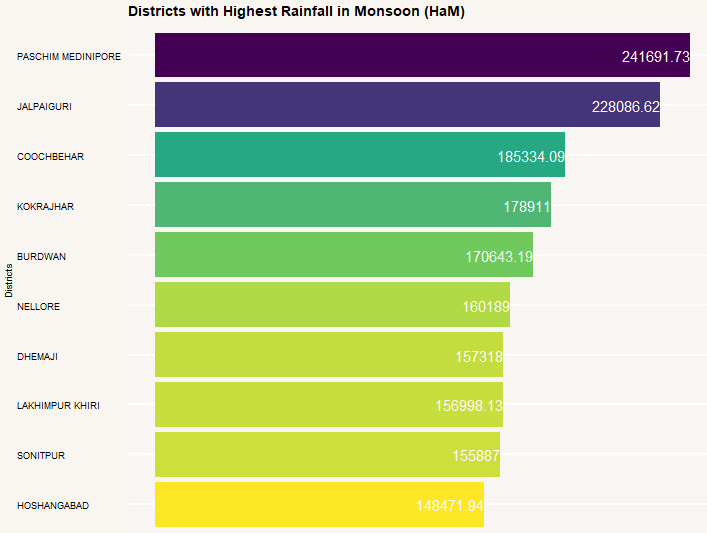
Paschim Medinipore district in West Bengal received the highest rainfall during monsoon season in India. Interestingly, the top 3 districts belong to West Bengal.
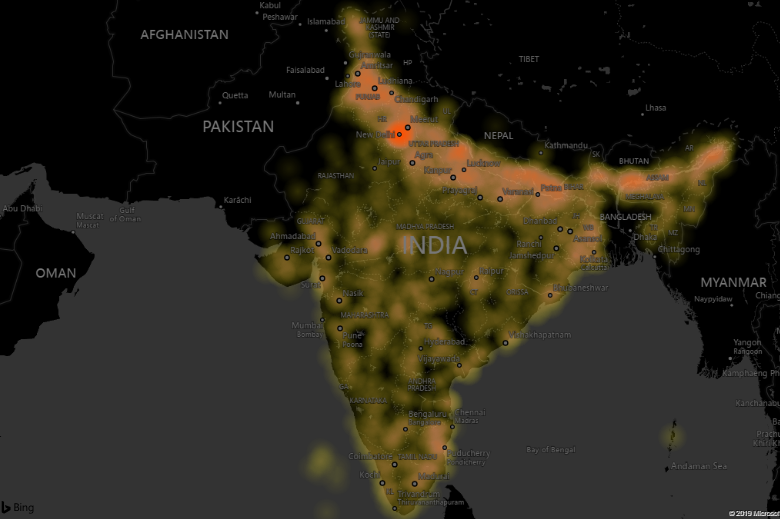
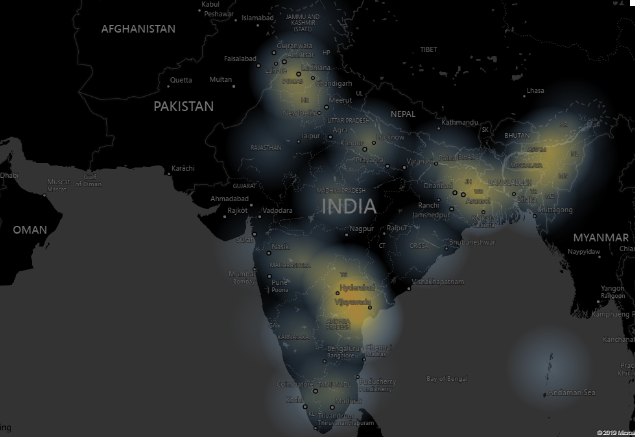
The below heatmap shows the districts with comparatively high groundwater availability in HaM. We can see the belt across the northeastern part of India. The districts falling under this belt had a high density of groundwater level in 2013.
When we see the average annual groundwater availability (HaM) by states, Telangana and Andra Pradesh take places in the top list. The numbers contradict with the current google searches. As per the report, Telangana sees a sharp drop in the groundwater table.
Let’s see what does projected demand for Domestic and Industrial Uses up to 2025 say. We have information about the current draft due to Domestic and Industrial water supply needs (2013) and projected demand (2025) for it. The below chart shows districts with the most % increase in the demand for Domestic and Industrial uses.
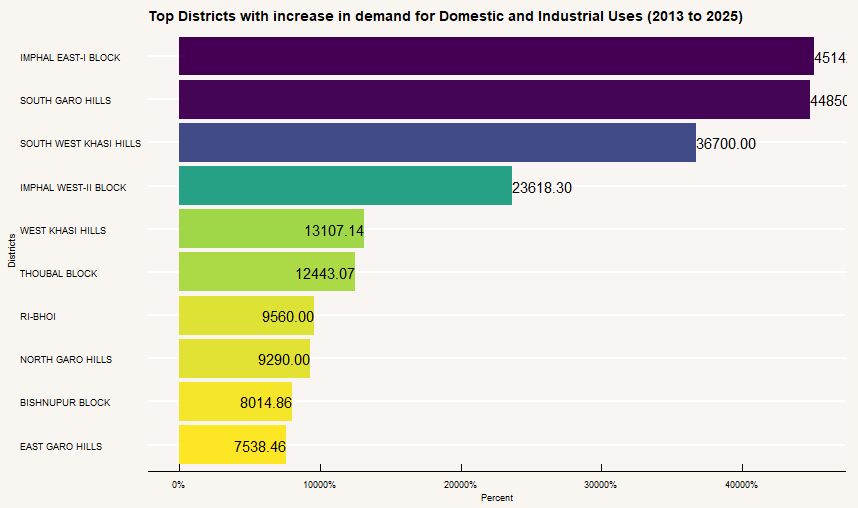
As you can in the above chart, these districts are expected to see a huge spike in the demand for domestic and industrial uses. Interestingly, all top districts belong to Manipur and Meghalaya states from northeastern India.
Let’s check out an important metric called a stage of groundwater development.
The stage of groundwater development is a ratio of Annual Ground Water Draft and Net Annual Ground-Water Availability in percentage. Ref. The reference page gives details of the criteria for the categorization of assessment units. We will create a factor column for an analysis purpose.
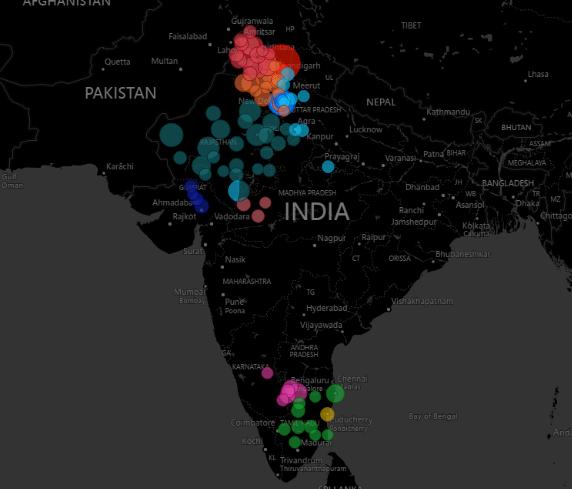
The below chart shows the overexploited districts of India. The size of the bubble shows how big exploitation is. I filtered the districts with the stage of groundwater development is more than 100%. Kala Amb district of Himachal Pradesh has the most stage of groundwater development of astounding 411%.
I created the categories as mentioned by Central Ground Water Board. I then developed a Power BI dashboard where we can filter the states and districts based on the category. Again, the bubble size determines the extent of exploitation.
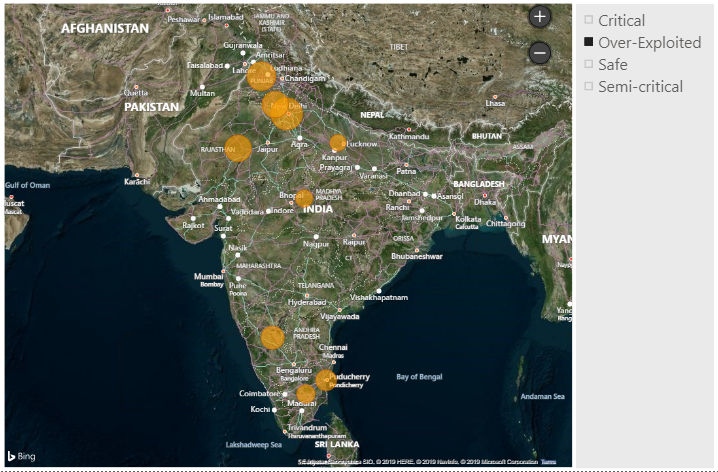
- Delhi has the highest average stage of groundwater development followed by Punjab and Haryana.
- Karnataka and Tamilnadu have overexploitation in South India.
- 16% of Indian districts are overexploited (2013). The number must have skyrocketed by now.
Thank you for reading this article!!


Leave a comment