USA Traffic Accidents!!
Happy New Year!!!
Recently I came across a dataset on Kaggle about USA traffic accidents (2016-19). As per the Kaggle, “This is a countrywide traffic accident dataset, which covers 49 states of the United States. The data is collected from February 2016 to March 2019, using several data providers, including two APIs which provide streaming traffic event data. These APIs broadcast traffic events captured by a variety of entities, such as the US and state departments of transportation, law enforcement agencies, traffic cameras, and traffic sensors within the road-networks. Currently, there are about 2.25 million accident records in this dataset.”
I found this dataset very interesting because of the data size and efforts authors put to gather the data. A huge shout out to them! There are many notebooks available on Kaggle for reference purposes. I explored the dataset using RStudio.
Acknowledgments
-
Please cite the following papers if you use this dataset: Moosavi, Sobhan, Mohammad Hossein Samavatian, Srinivasan Parthasarathy, and Rajiv Ramnath. “A Countrywide Traffic Accident Dataset.”, 2019.
-
Moosavi, Sobhan, Mohammad Hossein Samavatian, Srinivasan Parthasarathy, Radu Teodorescu, and Rajiv Ramnath. “Accident Risk Prediction based on Heterogeneous Sparse Data: New Dataset and Insights.” In Proceedings of the 27th ACM SIGSPATIAL International Conference on Advances in Geographic Information Systems, ACM, 2019.
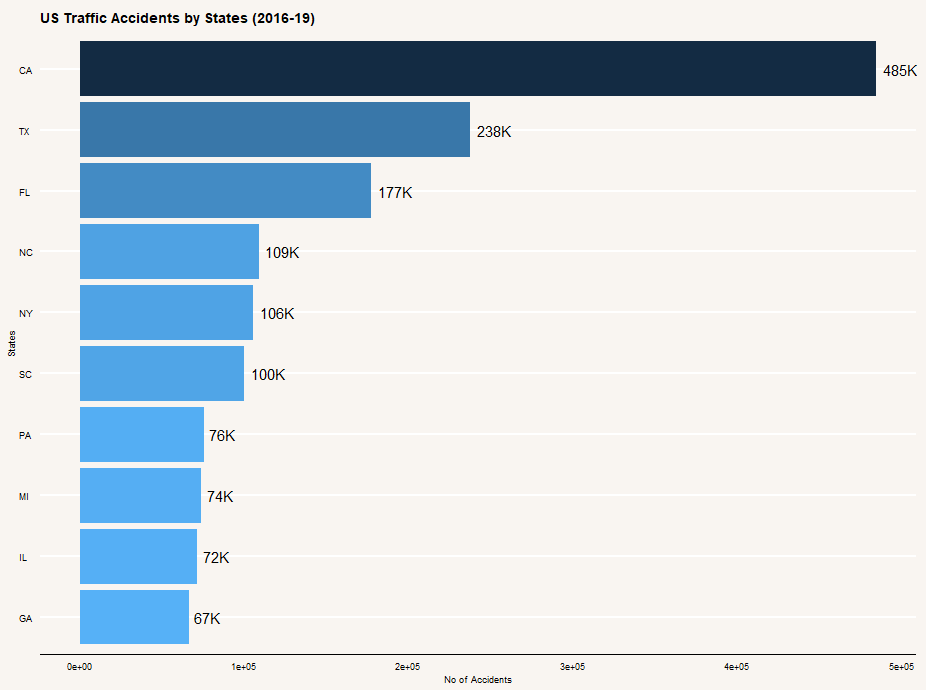
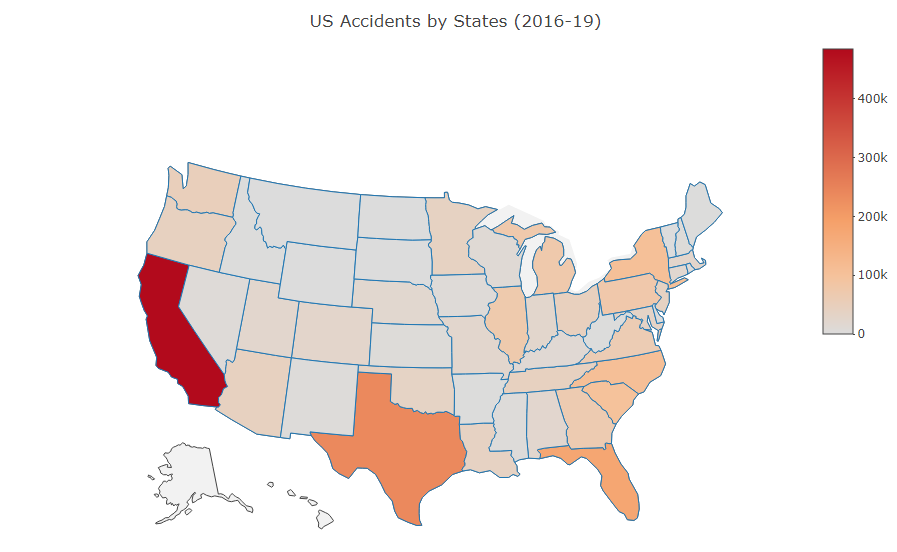
USA Traffic Accidents by States (2016-19)
As we can see, California tops the chart with the maximum number of traffic accidents in the period 2016-19. California has recorded more than double traffic accidents than that recorded in Texas.
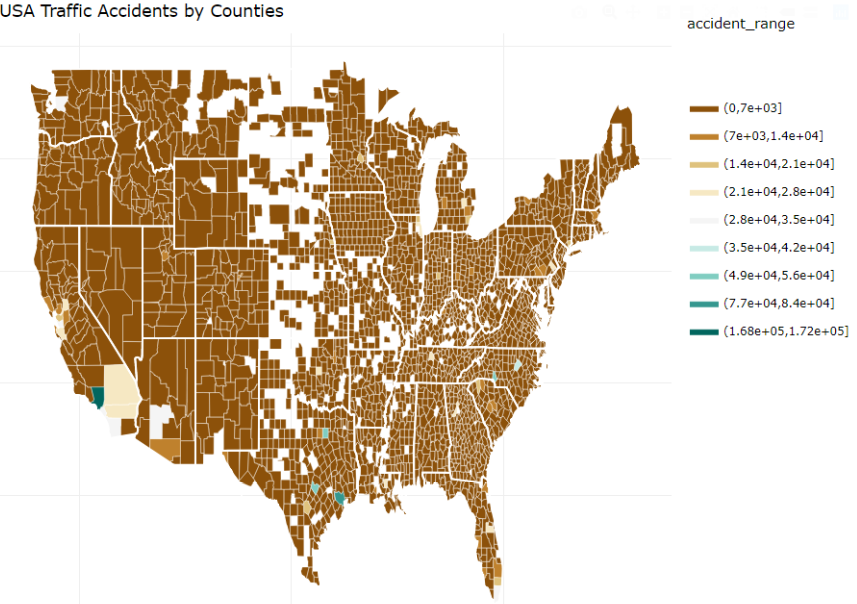
USA Traffic Accidents by Counties (2016-19)
Lod Angeles has recorded whopping 172K traffic accidents during this time period. LA is followed by Harris(TX) and Mecklenburg(NC).
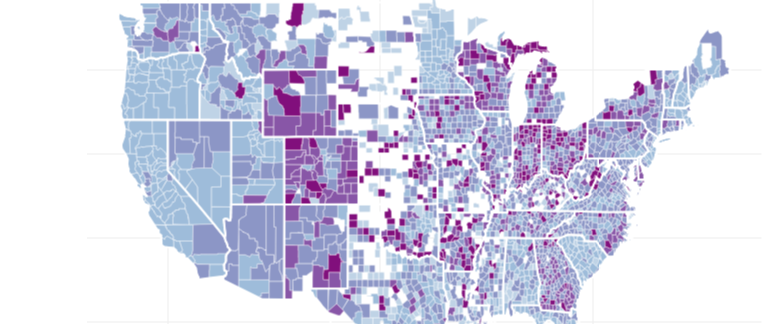
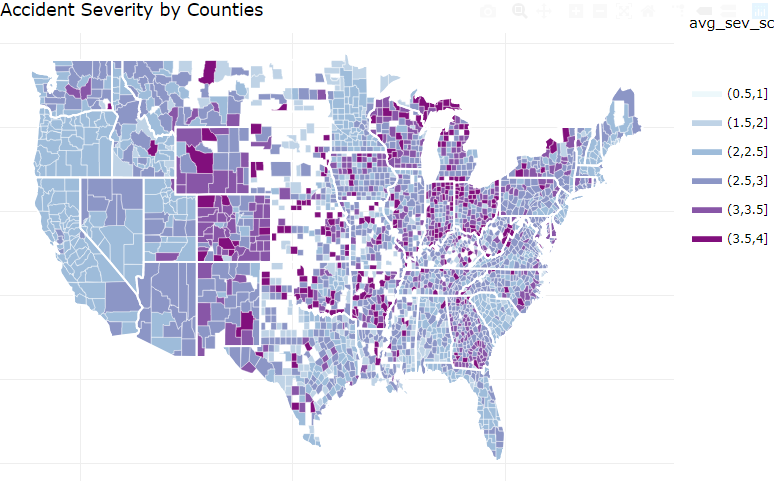
USA Traffic Accidents by Severity (2016-19)
South Dakota and Wyoming have high average traffic accident severity among all the states.
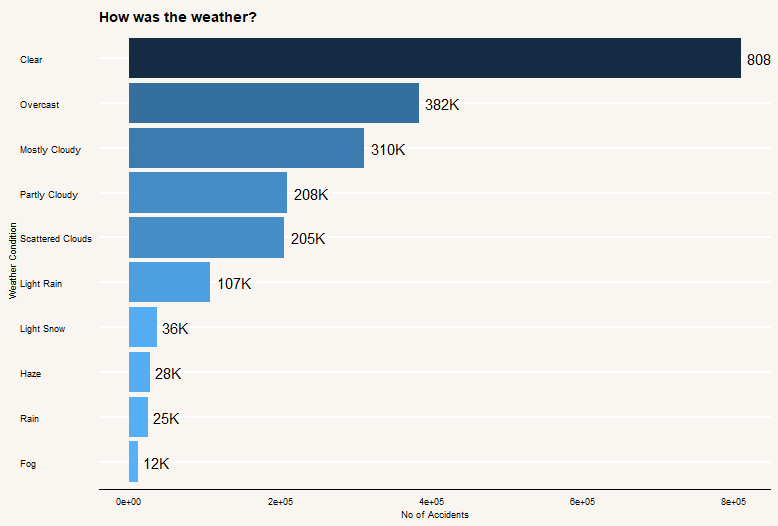
USA Traffic Accidents by Weather Conditions (2016-19)
Clear weather condition has over 800K traffic accidents recorded, but when we look for overcast & cloudy weather consitions together, they have over 1M traffic accidents recorded.

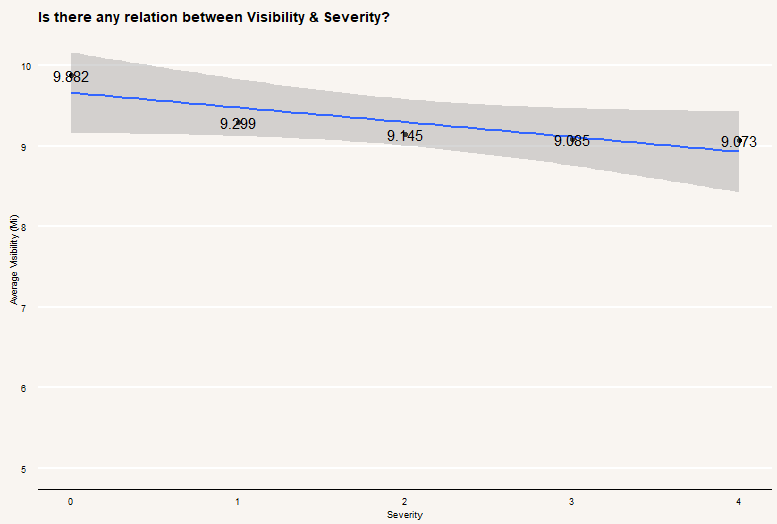
Relationship between Avg. Visibility & Severity
I aggregated the data by severity and calculated the average visibility at each level. The analysis shows shorter the visibility distance, higher the accident severity!
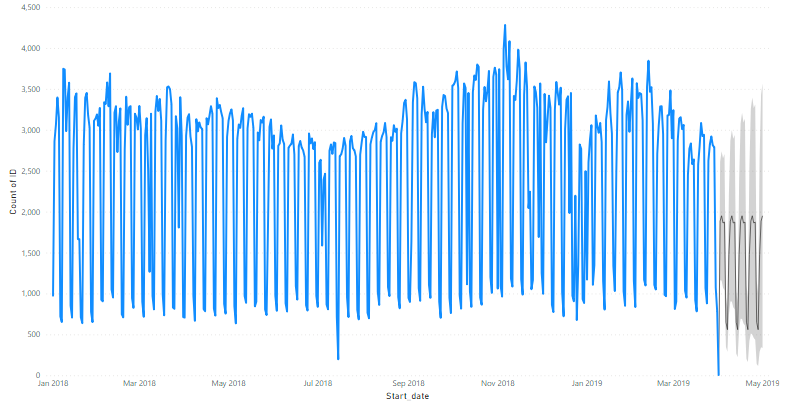
Can we predict the number of traffic accidents?
The number of traffic accidents follows a trend and cyclicity. If we see the data at the granular level (for a month and a city), we can observe a pattern. I tried to Auto Forecast the traffic accident count using Power BI for the entire dataset. We can use ARIMA or Hydrid of ML models and Statistical time series models to better predict the numbers. You can refer my sales prediction post to get a better understanding of time series forecasting.
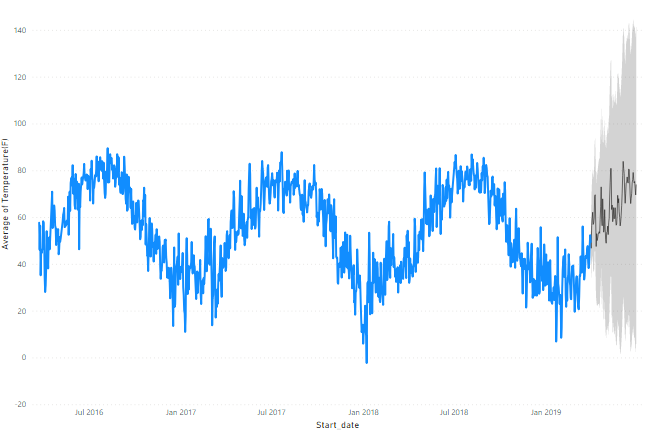
Temperature seasonality in the state of Connecticut
I filtered the data for Connecticut and plotted the average temperature for more than two years. We can see the seasonality with some dips in January. Also, the temperature dropped below 0 F on January 8, 2018, which we can in the chart.
Thank you for reading the post!


Leave a comment