
Cannibalization Effect in Optimization
Hi All,
Optimization is one of my favorite topics to brainstorm. I was working on an optimization problem where I had to incorporate a cannibalization effect.
Cannibalization Effect: Cannibalization is a challenger for any pricing strategist as the topic refers to the reduction in sales volume or revenue as a result of the introduction of a new product or service. For example, when Coca Cola introduced Coke Zero to compete alongside Diet Coke the introduction would have impacted the product. Ref
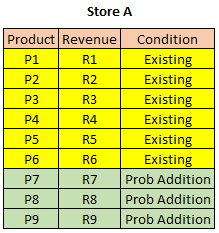
I have highlighted my implementation methodology in this post. I have taken an example of a store and supporting calculations. Consider than we have 6 products in a store as shown. We can introduce 3 new products and replace existing products based on the revenue performace. We can come up to probable addition product list by different techniques.
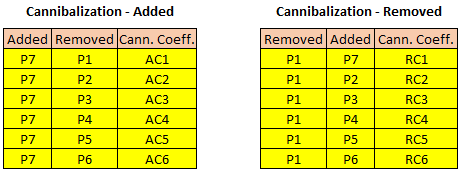
The below screenshot shows cannibalization coefficients both for addition and deletion. e.g. when the product P1 is removed as a part of optimization, its revenue R1 is split among other products and the product P2 would receive R1xRC2 addition revenue and so on. The situation is similar when a new product is added.
The below image shows an example of selection criteria. We are trying to remove product P1 and add product P7. The final revenue is the summation of individual product revenue and the components of actual revenue.
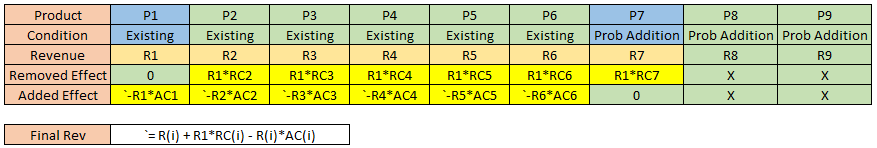
In the given example, we have 6 products in the store and 3 probable additions. So each product will have 3 probable substitutions and total of 6x3 = 18 combinations.
The next step is to write the loops for each of these combinations and select the best combination. I wrote this piece of code in R.
# Dataframe initialization
df_total = data.frame()
df_total_1 = data.frame()

df_col <- data.frame()
df_col_total <- data.frame()
for(w in 1:length(Replace_ind)){

  # Matrix initialization
  z1 <- matrix(Replace_ind,length(rep(1:length(Replace_ind),1)),1)
  z2 <- matrix(rep(1:length(r2),1),length(rep(1:length(r2),1)),1)

  # First FOR loop
  for(i in Replace_ind){
    # Second FOR loop
    for(j in 1:nrow(z2)){

      # Revenue
      s1 <- r1
      s1[i] <- r2[z2[j,]]

      # Product
      s2 <- p1
      s2[i] <- p2[z2[j,]]

      df_customer %>%
        gather("Prod","Rev",- UPC, - Product, - Condition, - revenue) %>%
        filter(substr(Prod,3,length(Prod)) %in% p1[i] | substr(Prod,3,length(Prod)) %in% p2[j]) %>%
        group_by(Prod) %>%
        mutate(grp_id = row_number()) %>%
        spread("Prod", "Rev", fill = 0) %>%
        arrange(grp_id)-> t1


      cann_rev <- t1[ , names(t1)[!(names(t1) %in% c("UPC","Product","Condition","revenue","grp_id"))]] %>%
        rowSums(na.rm = TRUE)

      # Revenue transfer from

      df_temp_created %>%
        filter(str_detect(Product,as.character(p2[j]))) %>%
        gather("Prod","Rev",- UPC, - Product, - Condition, - revenue) %>%
        filter(str_detect(substr(Prod,3,nchar(Prod)),as.character(p1[i]))) %>%
        pull(Value) -> cann_rev[i]

      # Adding two vectors

      s1 <- s1 + cann_rev
      print(append(sum(s1),s1))


      # Revenue table
      if(!is.na(sum(s1))){
        dat <- data.frame(t(append(w,append(i,append(j,append(sum(s1),s1))))))
        df_total <- rbind(df_total,dat)

        dat1 <- data.frame(t(append(w,append(i,append(j,append(999,s2)))))) #999 as a large number
        df_col <- rbind(df_col,dat1)}

    }
  }
Once we have combined data, we can select the combination with maximum revenue. It gives storewise highest revenue and best combination of products.
Please let me know your thoughts.
Thank you!!


Leave a comment