
AI Image Restoration using Excel and R
In 2015, I received a case study with an open problem asking to find an answer, that is all. It had an excel with a big sparse matrix. It was an image processing problem. I submitted a naive answer but the fastest to reach. I solved it in Excel with conditional formatting 😂. I think they were not expecting this approach but I came across a baseline solution with minimal resources. When I put conditional formatting on the matrix and zoom out the Excel to 10%, I arrived the answer 💪. Not all solutions need advanced approaches, common sense is important.
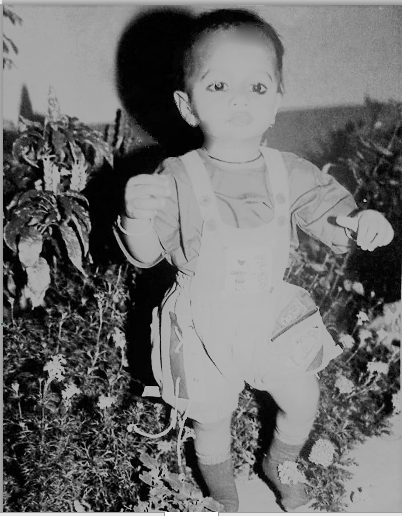
When I was going through my archive, I found this picture. My old picture but in deformed condition. I tried many online portals to bring it back to original, but most of them can’t restore it to the original. So, finally, get your hands dirty!

Let us import the image and extract the grayscale. Find the R code snippet below. I averaged out the values to fetch the grayscale values. The final line of code is the user-defined function to copy the data in clipboard then pasting in Excel.
library(raster)
library(dplyr)
library(tidyverse)
library(tibble)

color_image <- brick("E:\\Study\\Power_BI\\me.jpeg")
color_values <- getValues(color_image)

# Dimensions of the image
img_width <- 400
img_heigh <- 533

color_table <- as.data.frame(color_values)
color_table$avg <- (color_table$me.1 + color_table$me.2 + color_table$me.3)/3

append_vector <- rep(1:img_width,img_heigh)
append_vector1 <- rep(1:img_heigh, each = 400)

color_table$rank <- append_vector
color_table$sr_no <- append_vector1

color_table$me.1 <- NULL
color_table$me.2 <- NULL
color_table$me.3 <- NULL

color_table %>%
  tidyr::spread(rank, avg) -> color_table1

color_table1$sr_no <- NULL

# Copying the large matric in Excel
copy(color_table1)
Once I converted it to grayscale and pasted the matrix in Excel, these are the steps I followed:
- Shortening the Column width (Alt + O + C + W) to 1.
- Shortening the Row height (Alt + O + R + E) to 5.
- Zooming out the excel to 10%.
This is how it looks in Excel!! We can see the white patches on the picture predominantly.

Now it is time to try for different kernels to smoothen the image. I tried two approached:
- Using a 3X3 kernel to fill the center value.
- Using the values of 24 cells around the targeted cell to fill it.
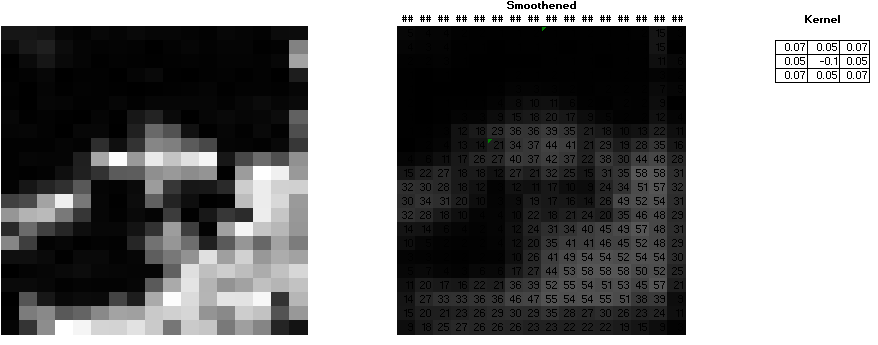
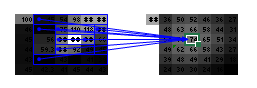
If you see the below screenshot, you can trace precedents using Excel formulas. Each output cell is calculated by multiplying the kernel and the original image matrix. It is a kind of Convolution in Excel.
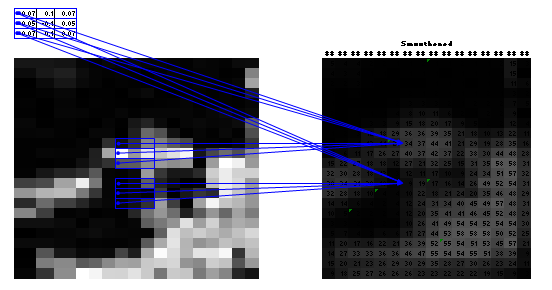
The second method of averaging the cell values around worked better. If we see the below screenshot, we can understand how the averaging works. I averaged out the values around the white patches. We can try using 8 cells, 24 cells, etc.
df <- readxl::read_excel("E:\\Study\\Power_BI\\my pic.xlsx",
                         sheet = "Sheet6")
# Creating the matrix
m = as.matrix(df)

# Saving the picture as jpeg format
as.cimg(m) %>% imrotate(90) %>% plot() %>% save.image("E:\\Study\\Power_BI\\MyPic.jpeg")
Once we save the image, it looks better now. Though it is available in grayscale, it is a good start. The next step will be to modify it on the RGB scale.
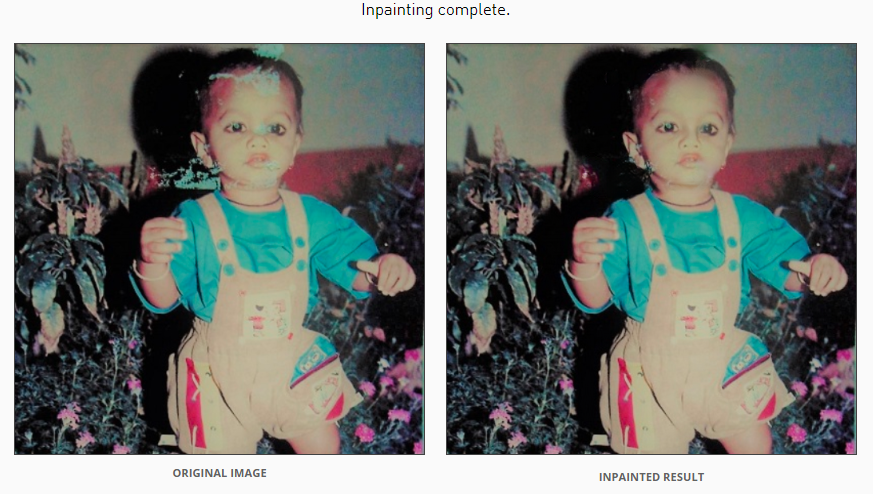
I tried IMAGE INPAINTING by NVIDIA. It also gave a good result. I think it can be improved by re-running by changing the brush strokes.
I came across an article that has listed a comprehensive list of researches and papers written by Jamshed Khan. A few of the resources are:
- Pluralistic Image Completion
- EdgeConnect
- SC-FEGAN
- Generative Multi-column Convolutional Neural Networks
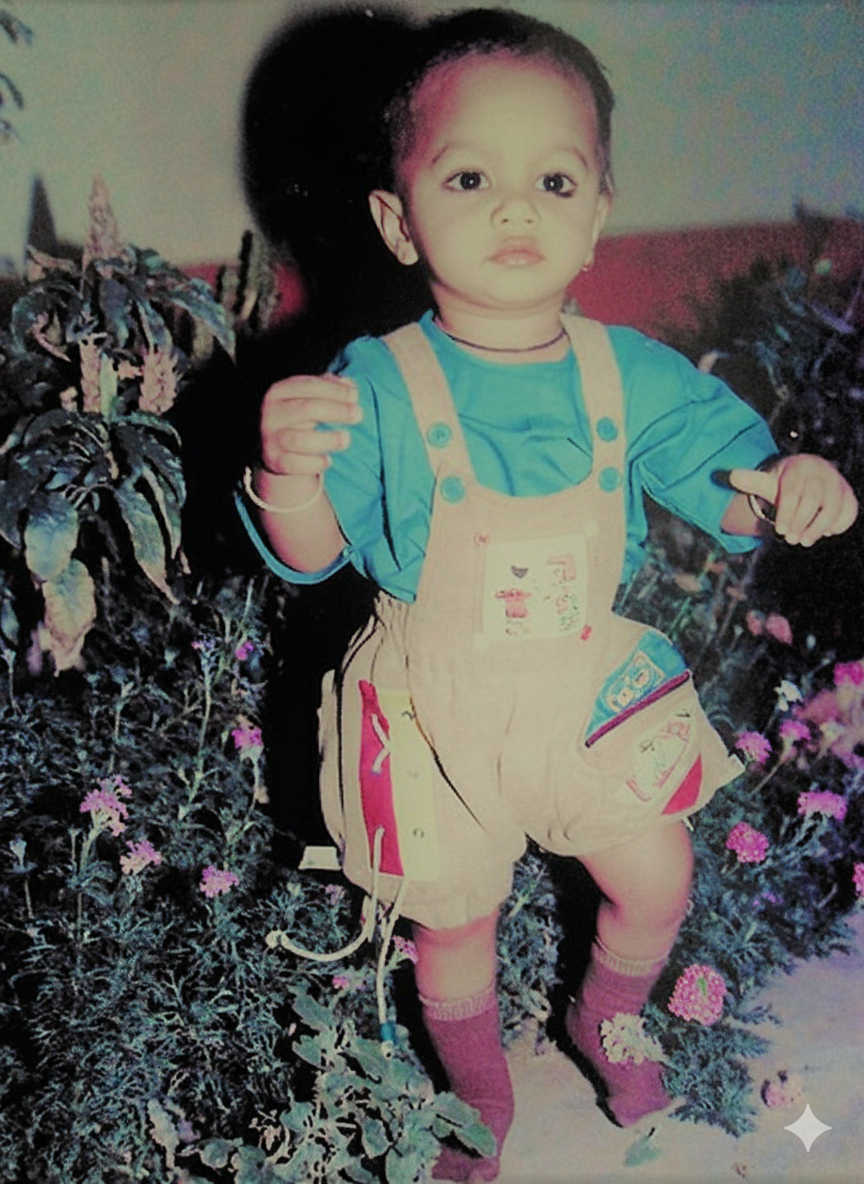
Fast forward to 09/2025. Google dropped Nano banana (Gemini 2.5 Flash Image) model and with below prompt, it regenerated the image. WOW !
remove the paint spots from the photo and maintain all the original features and hues
See you in the next post!!


Leave a comment