

Hands-On Experience To Weights and Biases (MLOps)!
Hi All,
Weights & Biases is a ML platform. As per the site, W&B’s tools can be used to: Track experiments Version and iterate on datasets Evaluate model perfomance Reproduce models Visualize results
As a part of the End to End MLOps project, I worked on MLFlow to track the model artifacts, hyperparameters, etc. I have also worked on MLFlow + Databricks combo at the enterprise level and found it very helpful. MLFlow is one of the experiment tracking tools out there in the market. Neptune and Wandb.ai are the other two promising entries. I thought of giving a try to W&B to see its functionality.
The best thing about W&B that I found among many others is quick setup. The W&B team has made user onboarding hassle-free. It is very important to have smooth user onboarding and activation in the product journey where W&B has nailed it. The library is free for personal use and experimentation!!
Steps are:
- Free W&B account creation and authorization key generation
- Installing ‘wandb’
- Log in to the W&B account using an API token
Let’s code a simple example and log the metrics, artifacts, etc. to check model performance. I have taken a simple classification example to predict whether a customer will change telco provider. The dataset is available on kaggle. The evaluation criterion is Accuracy. The below walkthrough does not include all columns from the raw dataset. Also, the basic models are fit to check the MLOps functionality without much hyperparameter tuning.
Let’s import libraries required for data analysis, model building, and model tracking.
# Importing required libraries for analysis
import json
import yaml
import joblib
import argparse
import wandb
import numpy as np
import pandas as pd
from sklearn.ensemble import RandomForestClassifier
from sklearn.tree import DecisionTreeClassifier
from sklearn.metrics import f1_score,recall_score,accuracy_score,precision_score,confusion_matrix,classification_report

import warnings
from sklearn.exceptions import ConvergenceWarning
warnings.filterwarnings("ignore", category=ConvergenceWarning)
Once we have ‘wandb’ installed, run the below line of code and enter the authorization key copied from the weights and biases portal.
# wandb login with API token
wandb.login()
All the required helper functions are included in a single python script for demonstration purposes. I added docstrings in functions to provide a brief overview. I am reading a config file, loading train, and test datasets, separating features and targets, and defining the accuracy measures.
def read_params(config_path):
    """
    read parameters from the params.yaml file
    input: params.yaml location
    output: parameters as dictionary
    """
    with open(config_path) as yaml_file:
        config = yaml.safe_load(yaml_file)
    return config

def accuracymeasures(y_test,predictions,avg_method):
    """
    calculate accuracy measures
    input: y_test, predictions, avg_method
    output: accuracy measures
    """
    accuracy = accuracy_score(y_test, predictions)
    precision = precision_score(y_test, predictions, average=avg_method)
    recall = recall_score(y_test, predictions, average=avg_method)
    f1score = f1_score(y_test, predictions, average=avg_method)
    target_names = ['0','1']
    print("Classification report")
    print("---------------------","\n")
    print(classification_report(y_test, predictions,target_names=target_names),"\n")
    print("Confusion Matrix")
    print("---------------------","\n")
    print(confusion_matrix(y_test, predictions),"\n")

    print("Accuracy Measures")
    print("---------------------","\n")
    print("Accuracy: ", accuracy)
    print("Precision: ", precision)
    print("Recall: ", recall)
    print("F1 Score: ", f1score)

    return accuracy,precision,recall,f1score

def get_featatures_and_target(df,target):
    """
    Get features and target variables seperately from given dataframe and target
    input: dataframe and target column
    output: two dataframes for x and y
    """
    x=df.drop(target,axis=1)
    y=df[[target]]
    return x,y

def split_data(config_path):
    """
    split data into train and test
    input: config_path
    output: train and test dataframes
    """
    config = read_params(config_path)
    train_data_path = config["processed_data_config"]["train_data_csv"]
    test_data_path = config["processed_data_config"]["test_data_csv"]
    target = config["raw_data_config"]["target"]
    max_depth=config["random_forest"]["max_depth"]
    n_estimators=config["random_forest"]["n_estimators"]

    train = pd.read_csv(train_data_path, sep=",")
    test = pd.read_csv(test_data_path, sep=",")
    train_x,train_y=get_featatures_and_target(train,target)
    test_x,test_y=get_featatures_and_target(test,target)

    return train_x,train_y,test_x,test_y,max_depth,n_estimators
The below code snippet runs the main code leveraging the mentioned helper functions. I built a random forest model with max depth and no. of estimators are hyperparameters. It also calculated the feature importance and its indices for a plot.
if __name__=="__main__":
    args = argparse.ArgumentParser()
    args.add_argument("--config", default="params.yaml")
    parsed_args = args.parse_args()

    train_x,train_y,test_x,test_y,max_depth,n_estimators=split_data(config_path=parsed_args.config)

    # Train the RF model
    model = RandomForestClassifier(max_depth=max_depth,
                                    n_estimators=n_estimators)
    model.fit(train_x, train_y)
    y_pred = model.predict(test_x)
    y_probas = model.predict_proba(test_x)

    importances = model.feature_importances_
    indices = np.argsort(importances)[::-1]

    accuracy,precision,recall,f1score = accuracymeasures(test_y,y_pred,'weighted')
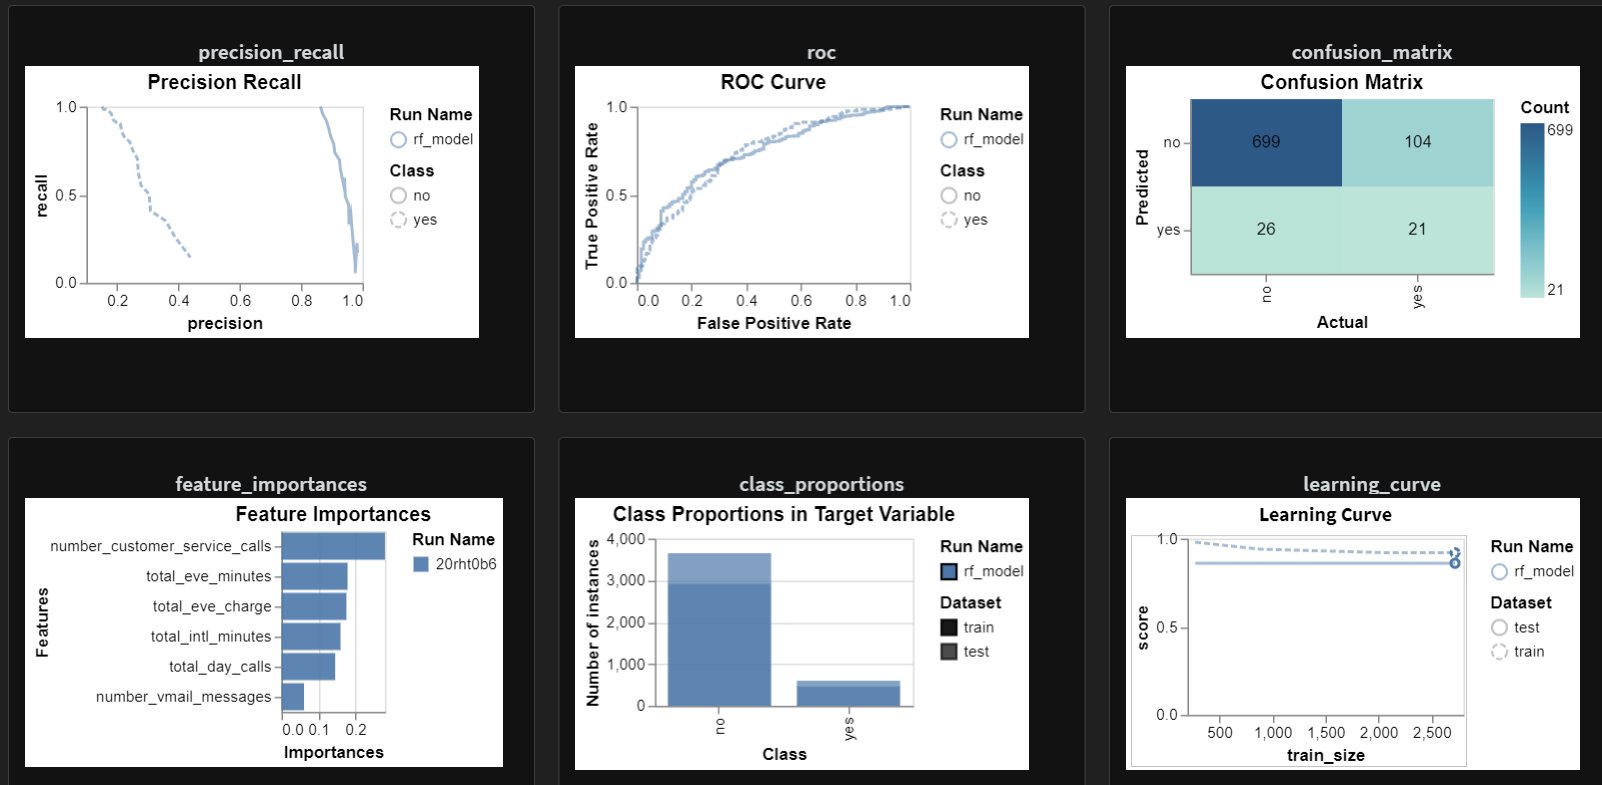
The below code is dedicated to weights and biases run. I initiated the run by giving project and model names. I used rf_model to highlight the current model. I logged the model performance plots such as the learning curve, confusion matrix, ROC plot. The feature importance plot is also available for tree-based models. It helped me to log the model metrics and artifacts as shown in the code. The plot classifier function didn’t run for me.
# Initialize W&B run

    run = wandb.init(project="churn_model", name="rf_model")

    # Log the model plots
    wandb.sklearn.plot_learning_curve(model,train_x,train_y)
    wandb.sklearn.plot_roc(test_y, y_probas, np.unique(train_y))
    wandb.sklearn.plot_confusion_matrix(test_y, y_pred, np.unique(train_y))
    wandb.sklearn.plot_precision_recall(test_y, y_probas, np.unique(train_y))

    # Class proportions
    wandb.sklearn.plot_class_proportions(train_y, test_y, np.unique(train_y))

    wandb.sklearn.plot_feature_importances(model, list(train_x.columns), indices)

    test_data_at = wandb.Artifact("test_samples_" + str(wandb.run.id), type="Metrics")

    test_table = wandb.Table(columns=["Accuracy","Precision","Recall","F1 Score"])
    test_table.add_data(accuracy,
                        precision,
                        recall,
                        f1score)

    test_data_at.add(test_table, 'Metrics')
    wandb.run.log_artifact(test_data_at)

    wandb.log({"accuracy":accuracy,
                "precision":precision,
                "recall":recall,
                "f1score":f1score,
                "max_depth":max_depth,
                "n_estimators":n_estimators})

    wandb.log({"table": pd.concat([test_y,test_x],axis=1)})

    """
    wandb.sklearn.plot_classifier(model,
                              train_x, test_x,
                              train_y, test_y,
                              y_pred, y_probas,
                              np.unique(train_y),
                              is_binary=True,
                              model_name='rf_model')
    """
    wandb.finish()
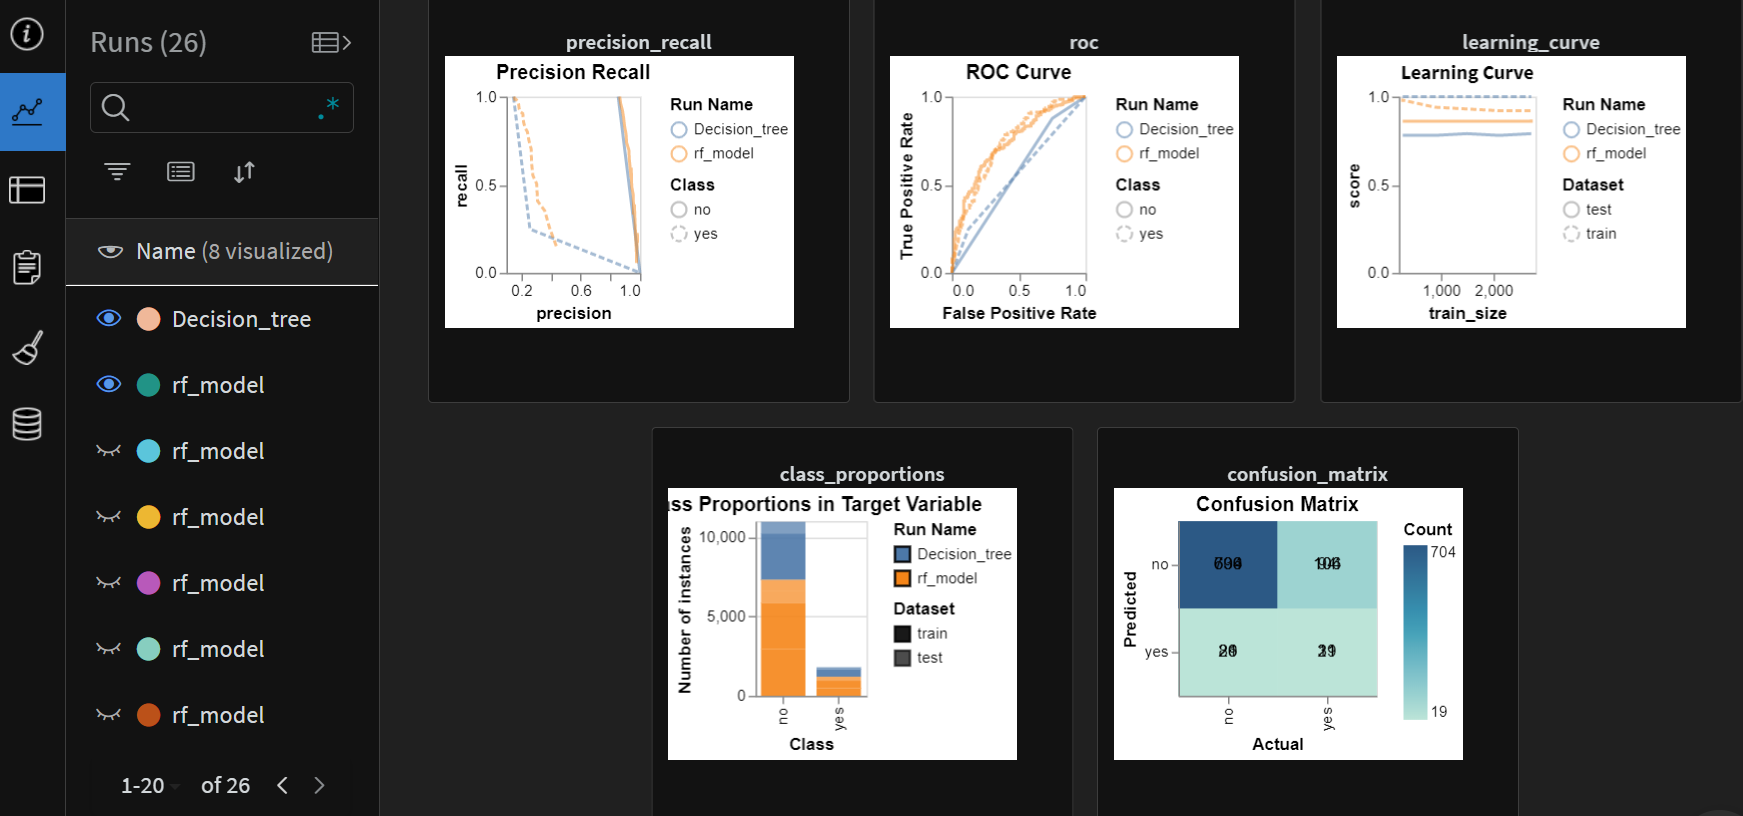
I added a decision tree classifier model for comparison purposes. We can compare the model performances on the W&B dashboard once pushed.
# Train the Decision tree classifier model
    model_DT = DecisionTreeClassifier()
    model_DT.fit(train_x, train_y)
    y_pred = model_DT.predict(test_x)
    y_probas = model_DT.predict_proba(test_x)

    importances = model_DT.feature_importances_
    indices = np.argsort(importances)[::-1]

    accuracy,precision,recall,f1score = accuracymeasures(test_y,y_pred,'weighted')

    # Initialize W&B run for DT model

    run = wandb.init(project="churn_model", name="Decision_tree")

    # Log the model plots
    wandb.sklearn.plot_learning_curve(model_DT,train_x,train_y)
    wandb.sklearn.plot_roc(test_y, y_probas, np.unique(train_y))
    wandb.sklearn.plot_confusion_matrix(test_y, y_pred, np.unique(train_y))
    wandb.sklearn.plot_precision_recall(test_y, y_probas, np.unique(train_y))

    # Class proportions
    wandb.sklearn.plot_class_proportions(train_y, test_y, np.unique(train_y))

    wandb.sklearn.plot_feature_importances(model_DT, list(train_x.columns), indices)

    test_data_at = wandb.Artifact("test_samples_" + str(wandb.run.id), type="Metrics")

    test_table = wandb.Table(columns=["Accuracy","Precision","Recall","F1 Score"])
    test_table.add_data(accuracy,
                        precision,
                        recall,
                        f1score)

    test_data_at.add(test_table, 'Metrics')
    wandb.run.log_artifact(test_data_at)

    wandb.log({"accuracy":accuracy,
                "precision":precision,
                "recall":recall,
                "f1score":f1score})

    wandb.log({"table": pd.concat([test_y,test_x],axis=1)})

    """
    wandb.sklearn.plot_classifier(model,
                              train_x, test_x,
                              train_y, test_y,
                              y_pred, y_probas,
                              np.unique(train_y),
                              is_binary=True,
                              model_name='rf_model')
    """
    wandb.finish()
Once we run the script, the plots and artifacts get logged to the portal. The below screenshot depicts the model metrics for the random forest model.
The comparison between the random forest and the decision tree models can be seen in the below chart. We can see the RF model outperforming the decision tree model.
We can create the reports from the workspace dashboards. The reports are highly customizable. We can add the context and comments to share with other team members. Overall, I enjoyed working on the W&B interface and liked the quick onboarding. I wish I would get a chance to work on this tool in the future.


Leave a comment